
We study the effects of the Dominican Republic–Central America–United States Free Trade Agreement (CAFTA-DR), signed in 2004, on the trade flows of its member states. Relying on the structural gravity model of trade framework, we find evidence of both increases and decreases in members’ bilateral trade, but also of significant differences in these effects depending on the direction of trade and the trading members. Using a counterfactual analysis, we are also able to measure the general equilibrium effects of CAFTA-DR, finding that it has, in general, increased both total exports and income levels for El Salvador, Guatemala, Honduras, and Nicaragua. However, we also find evidence of sizable trade diversion and welfare losses for Costa Rica and the Dominican Republic.
Avoid common mistakes on your manuscript.
In the year 2004, the Dominican Republic–Central America–United States Free Trade Agreement (CAFTA-DR) was signed. This agreement generated some expectation among other Latin American countries, as it was the first of its kind to be signed between the USA and a group of developing countries in the region. With entry into force, the agreement immediately liberalized the trade of almost all goods between members and phased in the market access for some of the members’ most important export goods. This paper provides an empirical evaluation of the main effects of the CAFTA-DR agreement on the members’ aggregate bilateral trade in goods more than 14 years after its entry into force. Using a state-of-the-art gravity model of trade, we analyze the specific effects of the CAFTA-DR agreement on each member’s trade, distinguished by trade flow and by trade partner and direction of the exchange. Of particular interest are the effects of CAFTA-DR on the welfare and trade levels of members. To the best of our knowledge, no other paper has so far tried to evaluate these effects within the empirical context of the structural gravity model of trade.
For the members in Central America and the Dominican Republic, the CAFTA-DR market represents an important source of their imports and the main destination of their exports. In general, more than half of the exports from these members go to the CAFTA-DR market, mainly to the USA. Likewise, even before the signing of the agreement, the USA was one of the largest, if not the largest, source of imports for the CAFTA-DR members. In contrast, the CAFTA-DR market is of relatively minor importance for the USA: about 1% of its exports go to CAFTA-DR countries, and this market represents the 18th largest source of imports for the USA. The apparent dominance of the USA among CAFTA-DR member states is much greater than that in the USMCA, Footnote 1 of which the effects have been extensively explored in the literature. Also, the Southern Common Market (Mercosur, by its Spanish acronym), the second important intra-regional FTA in terms of trade size in the Americas, has attracted considerably more attention in the literature compared to CAFTA-DR despite the fact that CAFTA-DR was the first free trade agreement (FTA) of its kind signed between a group of six developing countries in America and the USA, and thus provides a good opportunity for studying the effects of an FTA formation between small developing economies and a large developed economy. In addition, some elements of CAFTA-DR would serve as a reference for other similar negotiations in the region, as CAFTA-DR consolidated several pre-existing trade commitments among its members (Granados and Cornejo 2006). Therefore, it is interesting to evaluate its effects in terms of promoting both bilateral trade and welfare among its members.
The CAFTA-DR negotiations began during 2003 and were concluded in 2004 with the signing of the CAFTA-DR agreement, which entered into force in 2006 for most of its members Footnote 2 and liberalized trade flows between Costa Rica, El Salvador, Guatemala, Honduras, Nicaragua, the Dominican Republic, and the USA. With its entry into force, CAFTA-DR instantly eliminated tariff collection and/or eased customs procedures for several categories of goods traded between its members, but, as is common for FTAs, many of its trade concessions for some important agricultural and industrial goods were gradually phased in over a period of up to 20 years. Studies focusing specifically on CAFTA-DR have been relatively few compared to those that focused on NAFTA or Mercosur. However, CAFTA-DR is also an important regional trade agreement in the Americas since it directly links the USA with part of those countries that lie in its direct “backyard” and have for a long time been influenced not only by US foreign policy, but also by the commercial interests of leading US multinationals. In a speech at the Organization of American States (OAS), US President George W. Bush stated that CAFTA-DR would help members improve the welfare of their citizens, as the cut in tariffs would increase trade among members and the agreement would attract more investment (OAS 2005). This paper therefore examines the effects of CAFTA-DR on its members’ bilateral trade and welfare levels in the light of new theoretical advances pertaining to the estimation of the structural gravity model of trade.
In international trade, the gravity model has been widely used in empirical research. In its most basic form, this type of model relates the bilateral trade flows between two countries to their income levels and to a measure of their bilateral trade costs, such as the geographical distance between the two. During the beginning of the 2000s, the gravity model of trade received important contributions to its theoretical basis through the works of Eaton and Kortum (2002) and Anderson and van Wincoop (2003), who developed a more solid theoretical foundation for the gravity model based on the Ricardian trade model and the Armington-CES framework, respectively. Anderson and van Wincoop (2003) made an important contribution to the gravity literature by pointing out the importance of including multilateral resistance terms in the gravity model, which measure the ease of access to the market for importing and exporting countries (Head and Mayer 2014), and need to be accounted for in the model estimation.
The gravity model estimation technique has also improved considerably in recent years. It is by now common practice to use the Poisson pseudo-maximum likelihood (PPML) estimation instead of the more traditional OLS regression with log transformation, since PPML is more robust against the presence of heterogeneity in the data than OLS and can easily handle zero trade flow observations (Santos Silva and Tenreyro 2006). The importance of accounting for possible endogeneity when estimating the effects of FTAs, which can lead to a biased estimation of their effects, has also been acknowledged. This endogeneity problem can be solved, at least partially, by the inclusion of country-pair fixed effects in the estimation, which capture any country-pair unobservable characteristics (Baier and Bergstrand 2007). Another major improvement in the gravity estimation has been the inclusion of intranational trade flows (for reasons to include these trade flows despite empirical challenges to calculate them, see Yotov et al. 2016 and Yotov 2022). In particular, Bergstrand et al. (2015) point out that international trade costs have been falling over time and suggest accounting for this development by introducing additional indicator variables, either an international border variable or the geographical bilateral distance variable, interacted with year fixed effects, in the estimation.
In recent years, some authors have developed special approaches to simultaneously measure heterogeneity in the effects of different FTAs and also of member-pair and member-pair-direction effects within the same FTA, using gravity models of trade. Important examples of this are the empirical work of Carrère (2006) and the works of Zylkin (2016) and Baier et al. (2019), whose approaches allow deeper assessments of FTA effects. Regarding the welfare effects of FTAs, Yotov et al. (2016) develops a general procedure to estimate such effects, based on the general equilibrium properties of the structural gravity model of trade, using the PPML estimator. Relying on this procedure, it is possible to measure the changes in income levels and total exports (trade creation or diversion) derived from, for example, the hypothetical creation or elimination of an FTA.
In general, most studies on CAFTA-DR focus on its trade concessions and its possible effects ex ante. Footnote 3 Regarding the analysis of CAFTA-DR’s ex post effects, most existing studies analyze its effects on a particular member state. The results of studies focusing on CAFTA-DR’s average effect on members’ bilateral trade appear inconclusive. El Dahrawy Sánchez-Albornoz and Timini (2021) and Nguyen (2019) found no significant evidence of a positive average effect of CAFTA-DR on members’ bilateral trade. As for the effects of CAFTA-DR on bilateral trade for particular members, the evidence is similarly mixed, ranging from positive to negative effects depending on the country. Moreover, the studies do not cover all members of the agreement. Sandoval et al. (2015) explores CAFTA-DR’s effects on exports and imports of El Salvador, Koehler-Geib and Sanchez (2015) focus on Costa Rican exports and imports to and from the USA, and Reyes Peguero and Hansen (2019) only explore the agreement’s effects on Dominican exports with a particular focus on the exports to the USA.
Additionally, Spilker et al. (2018) explores CAFTA-DR’s effects on Costa Rica’s intensive and extensive margins of trade to the USA, and Cruz Rodríguez and Calvo Clúa (2016) analyze the effects of CAFTA-DR on the Dominican Republic’s intra-industry trade with the other member states. Hicks et al. (2014) analyze the political economy behind the referendum on CAFTA-DR ratification in Costa Rica. The role of trade openness and economic growth with a special emphasis on the case of CAFTA-DR has been explored by Poggio and Calderon (2010).
As the above literature review shows, the existing research on the CAFTA-DR agreement is far from comprehensive with regard to the evaluation of its effects. As mentioned above, many of the studies have focused on only one particular member and considered only the effects of CAFTA-DR on this member’s exports or imports, but there is not yet a consistent estimate of the bilateral trade effects for all members. Similarly, to our knowledge, no estimate exists of the welfare effects of CAFTA-DR on its members, using the framework of the structural gravity model of trade. Knowing these effects, both with regard to members’ bilateral trade and welfare levels, is of vital importance in comprehensively assessing any FTA, and in particular CAFTA-DR which has been deemed highly important not only for the involved Central American countries, but also by the USA seeking to tighten the economic connections to the states in their “backyard.”
This paper expands the literature on the member-pair-direction heterogeneous effects within the same FTA by estimating these effects for CAFTA-DR by using a state-of-the-art gravity model. Therefore, this paper adds to the literature that studies the heterogeneous effects of FTAs, similarly to Zylkin (2016) and Baier et al. (2019). In addition, using the general procedure presented in Yotov et al. (2016), we conduct a counterfactual experiment to measure the general equilibrium effects of CAFTA-DR on members’ income and trade levels, based on our initial estimates of its heterogeneous effects on the member states.
The remainder of this paper is organized as follows: Section 2 provides a brief overview on CAFTA-DR, its members, and previous research relating to it. Section 3 presents a description of the data used and explains how the dataset was constructed. In Section 4, we develop the empirical specifications used to measure the effects of CAFTA-DR on bilateral trade and welfare levels. In Section 5, the empirical results are presented. Section 6 summarizes our main findings about the effects of CAFTA-DR and concludes.
CAFTA-DR was signed in 2004 by its member states to improve and facilitate their commercial relationships. The CAFTA-DR negotiations began in January 2003 without the Dominican Republic, which joined the negotiations in July 2004 (Paggi et al. 2005; Storrs et al. 2004; Pacheco and Valerio 2007).
CAFTA-DR went into force in 2006 for most member states, except for the Dominican Republic and Costa Rica, where the agreement went into effect in 2007 and 2009, respectively (World Trade Organization 2016b). Costa Rica conducted a national referendum to ratify the agreement (Hicks et al. 2014). Among the objectives of CAFTA-DR were the increase and diversification of trade between members, and the elimination of trade barriers to improve the mobility of goods and services (United States, Costa Rica, Dominican Republic, El Salvador, Guatemala, Honduras and Nicaragua 2004). As a comprehensive agreement, CAFTA-DR not only did touch upon aspects related to bilateral trade, but also included provisions on intellectual property rights, labor and environmental regulations, and governmental procurement (United States et al. 2004; Storrs et al. 2004).
With its implementation, CAFTA-DR allowed 100% of non-textile and non-agricultural goods of member states to enter duty-free into the USA (Hornbeck 2012). In the case of textile and apparel goods, these can enter the USA duty and quota free if they meet the rules of origin criteria (Storrs et al. 2004; World Bank 2005). CAFTA-DR also includes tariff rate quotas for some sensitive goods of members with long-run tariff protection as a way to generate immediate market access for these sensitive goods (Paggi et al. 2005). For the United States’ exports to the CAFTA-DR markets, CAFTA-DR immediately eliminated tariffs on 80% of non-textile manufactured goods and 50% of agricultural goods (Storrs et al. 2004). For the remaining shares of these goods, their access to the CAFTA-DR markets was phased in over periods from 10 up to 20 years (Storrs et al. 2004; Hornbeck 2012). Thus, CAFTA-DR generated a significant market opening for United States’ agricultural goods in the long run, since Central American tariffs on these goods were higher in comparison to the ones applied to manufactured imports (Paggi et al. 2005).
Most of the adjustment from CAFTA-DR, in terms of trade, fell on Central American countries and the Dominican Republic. The US adjustment was relatively less significant, as they had given preferential trade access to the other members already several decades before CAFTA-DR, even though the USA did not receive equal treatment from the other members (Paggi et al. 2005). Exports of the CAFTA-DR members received unilateral and preferential market access to the USA from three main sources: the Caribbean Basin Economic Recovery Act (CBERA), the Generalized System of Preferences (GSP), and the Caribbean Basin Trade Partnership Act (CBTPA) (Dypski 2002; Storrs et al. 2004; Hornbeck 2012). During 2004, the proportion of CAFTA-DR members’ exports to the USA that benefited from the CBERA was as follows: Costa Rica, 32.7%; El Salvador, 54.6%; Guatemala, 37.6%; Honduras, 63%; Nicaragua, 33.6%; and the Dominican Republic, 57.3% (Pacheco and Valerio 2007). However, with the ratification of CAFTA-DR, the members were excluded from the benefits provided by both CBERA and CBTPA (Hornbeck 2012; Huegel and Kostrzewa 2013).
Prior to CAFTA-DR, Central American members already had a significant degree of economic and commercial integration. Their integration began during the 1960s with the signing of the General Treaty on Central American Economic Integration, the formation of the Central American Common Market (CACM) to promote economic growth, and the most recent formation of the Central American Integration System (SICA by its Spanish acronym) to foster cooperation (Storrs et al. 2004; Koehler-Geib and Sanchez 2015). In addition, the Dominican Republic also shared a certain degree of integration with these members prior to CAFTA-DR, having signed an FTA Footnote 4 with them in 1998 (Granados and Cornejo 2006; World Trade Organization 2016a) and becoming an associated member of SICA in 2003 and a full member in 2013 (SICA 2013). An important aspect of CAFTA-DR is that it recognizes these previous trade commitments and consolidates them into a single legal document, adopting an important part of their previous trade concessions with some modifications, preventing these countries from fragmenting their trade as a consequence of these commitments (Granados and Cornejo 2006).
The trade agreement signed between the Dominican Republic and Central America entered into force between late 2001 and late 2002 for its members, under the name Tratado de Libre Comercio entre Centroamérica y la República Dominicana (Central America-Dominican Republic Free Trade Agreement or CA-DR FTA in English). The agreement was negotiated with the intention of establishing a free trade zone between the Dominican Republic and each member from Central America, under the dispositions of Article XXIV of the General Agreement on Tariffs and Trade of 1994 and Article V of the General Agreement on Trade in Services (Costa Rica, Dominican Republic, El Salvador, Guatemala, Honduras and Nicaragua 1998). The members agreed to liberalize access to their respective markets through the total elimination of customs duties on trade in goods. The agreement is based on the principle of a negative list, as trade was liberalized immediately for all goods except those included in a special list (Granados and Cornejo 2006). This principle and the special treatment established by the Central America–Dominican Republic FTA were incorporated in the CAFTA-DR text, making the previous FTA unnecessary so that its members could agree on terminating it once CAFTA-DR took effect (Granados and Cornejo 2006). However, according to information from the World Trade Organization (WTO) of 2016, the agreement remains active for all its members (World Trade Organization 2016a). Despite the overlapping treaties, it is unlikely that this would generate any difficulties in trade between Central America and the Dominican Republic, as the member states could choose to use the concessions derived from CA-DR FTA or CAFTA-DR without much of a problem (Granados and Cornejo 2006).
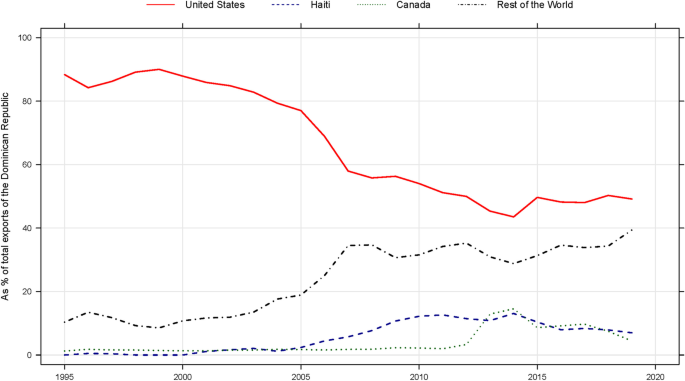
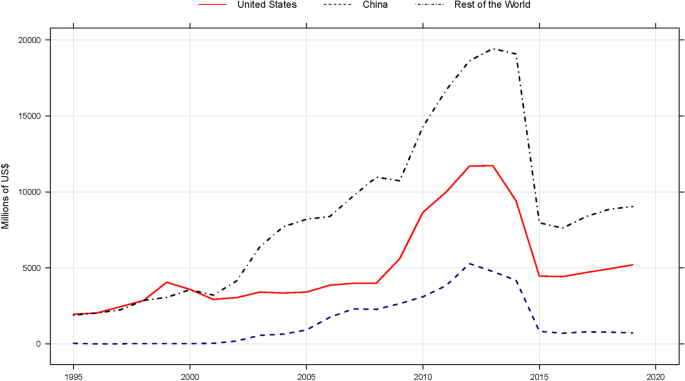
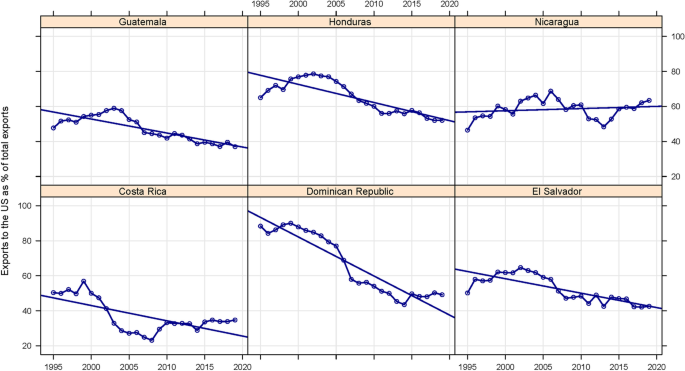
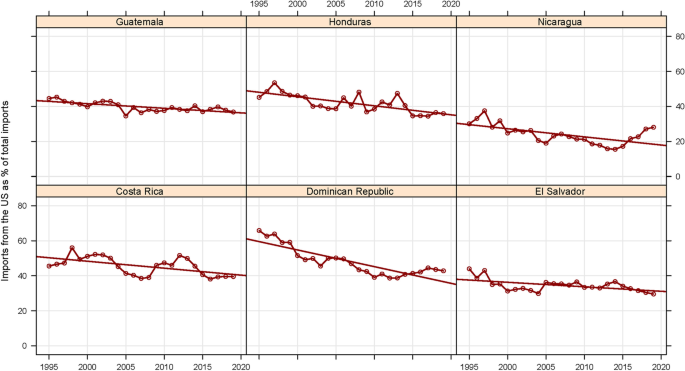
For the Central American countries and the Dominican Republic, trade with the USA is very important, as the USA is not only their main source of investment and bilateral assistance, but also the most important source of imports and the main destination of their exports (Storrs et al. 2004). Between 1995 and 2004, the CAFTA-DR member exports to the USA represented more than half of their total exports (Fig. 1), but only around 1.5% of the US total exports went to these countries during the same period (Fig. 2). Hence, the trade dependence of the CAFTA-DR countries on the US market prior to the agreement was significant, in contrast to the limited importance of these countries’ markets for the US exports.
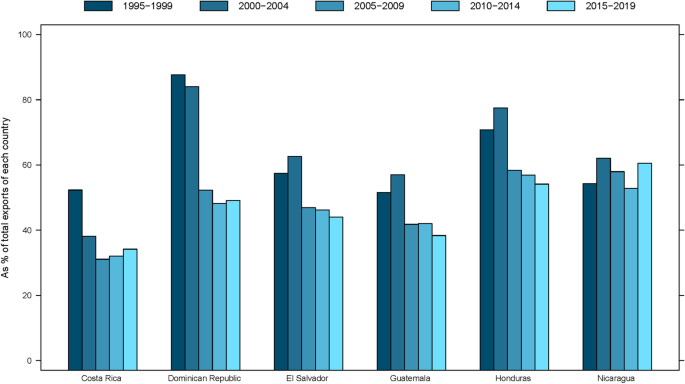
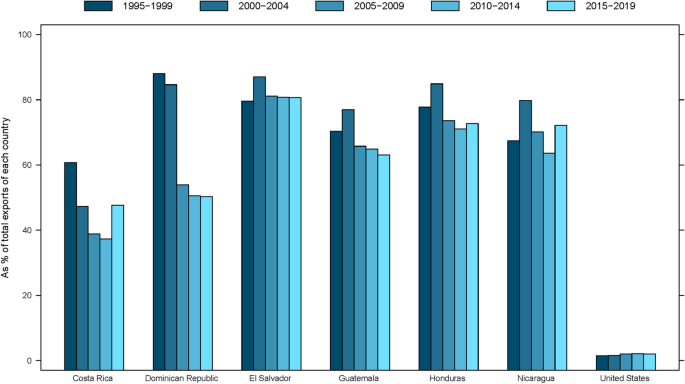
After the CAFTA-DR entered into force, dependence on the US market as a major export destination decreased for all CAFTA-DR members, with the exception of Nicaragua (Fig. 1). As Fig. 1 shows, all members but Nicaragua significantly reduced their export shares to the USA between 2005 and 2019 compared to the period between 1995 and 2004: counterintuitively, CAFTA-DR members appear to be systematically moving away from the USA as their main export destination. The member who most reduced its exports to the USA was the Dominican Republic, going from more than 80% between 1995 and 1999 to around 50% between 2015 and 2019 (Fig. 1). On the other hand, exports to the CAFTA-DR market as a percentage of each member’s total exports declined with its entry into force (Fig. 2), except for the USA, whose share slightly increased. This reduction in the members’ share of exports to the CAFTA-DR zone is primarily a consequence of the declining importance of the USA as the main export destination for these countries.
The decline in the Dominican exports to the USA deserves special attention. Given its strong dependence on the US market before the enforcement of CAFTA-DR, one would have expected the share of Dominican exports to the USA to increase or, at least, remain constant. Three main developments could explain the observed decline: (1) increased competition with external competitors for the US market; (2) a structural change in Dominican exports due to the world financial crisis of 2007–2009; and (3) particular shocks to Dominican exports. With respect to the first possible explanation, Reyes Peguero and Hansen (2019) find evidence for a negative correlation between the real growth rate of Chinese exports to the US and of Dominican exports to the USA. In other words, Chinese exports could have replaced exports from the Dominican Republic and probably also other countries to the US market. This development probably started with China’s WTO entry at the end of 2001. The second explanation seems a less likely cause of the observed decline in the share. As shown in Fig. 3, the share of Dominican exports to the rest of the world had already been increasing since the beginning of the 2000s. Likewise, Reyes Peguero and Hansen (2019) find no evidence that the global financial crisis affected Dominican exports to the rest of the world or to the USA between 2008 and 2009. Lastly, Fig. 3 shows two possible external shocks for Dominican exports, as manifested in significant increases in the shares of Haiti and Canada. In the case of Haiti, this is probably a consequence of the destruction of its production capacity by the 2010 earthquake: As Haiti and the Dominican Republic share a direct border, the Dominican exports to Haiti would have increased because of the demand that could not be met by Haiti’s diminished productive capacity. Exports to Canada would have increased as a result of mining concessions given to a Canadian company to extract gold and other metals in Pueblo Viejo, Dominican Republic. The production of this mine began around 2012–2013 (Redwood 2015), and since 2013, almost all Dominican exports to Canada have consisted of gold and other precious metals.
Another important aspect that needs to be addressed in more detail here is the Costa Rican exports to the USA. In Fig. 4, we can see the surprising increase of Costa Rican exports to the USA after 2009 and until 2013. After 2013, Costa Rican exports to the USA and also to the rest of the world decreased significantly. This development is difficult to explain, but it may be a consequence of exchange rate distortions between the Costa Rican colon and the US dollar: The colon appreciated considerably versus the US dollar in the winter of 2013/2014, whereas it had strongly depreciated in the fall of 2009 (based on daily exchange rates provided by St. Louis Federal Reserve online tool).
The empirical literature on the effects of CAFTA-DR on members’ bilateral trade is relatively limited. In general, most studies on CAFTA-DR focus on its trade concessions and its possible effects ex ante, like Paggi et al. (2005), Storrs et al. (2004), Granados and Cornejo (2006), and Pacheco and Valerio (2007). Regarding the analysis of CAFTA-DR’s ex post effects, the existing studies analyze its effects on a particular member state in most of the cases. The results of studies focusing on CAFTA-DR’s average effect on members’ bilateral trade appear inconclusive. Both El Dahrawy Sánchez-Albornoz and Timini (2021), which focused on the average effects of many trade agreements in the region of Latin America, and Nguyen (2019), which put a special effort on the average and trade diversion effects of several trade agreements, could not find significant evidence of any effect on members’ bilateral trade.
As for the effects of CAFTA-DR on bilateral trade for particular members, the evidence is similarly mixed, ranging from positive to negative effects depending on the country. The studies typically do not cover all members of the agreement; however. Sandoval et al. (2015) explores CAFTA-DR’s effects on exports and imports of El Salvador, finding no evidence that CAFTA-DR has had a significant and positive impact on imports or exports of this country. Another example is the work of Koehler-Geib and Sanchez (2015), who find that CAFTA-DR increased both Costa Rican exports to the USA and imports from the USA, although the agreement’s effect on imports was not statistically different from zero. Also, a recent study on the effect of CAFTA-DR on the exports of the Dominican Republic concluded that it did not increase exports from the Dominican Republic to CAFTA-DR members and that the agreement is associated with a reduction in Dominican exports to the USA (Reyes Peguero and Hansen 2019).
Additionally, Spilker et al. (2018) explores CAFTA-DR’s effects on Costa Rica’s intensive and extensive margins of trade to the USA, and Cruz Rodríguez and Calvo Clúa (2016) analyze the effects of CAFTA-DR on the Dominican Republic’s intra-industry trade with the other member states. Hicks et al. (2014) analyzes the political economy behind the referendum on CAFTA-DR ratification in Costa Rica. The role of trade openness and economic growth with a special emphasis on the case of CAFTA-DR has been explored by Poggio and Calderon (2010).
For the analysis of the CAFTA-DR effects on the bilateral trade of member states, the two main sources of data are the July 2022 (release 2) update of the International Trade and Production Database of Estimation (ITPD-E) and the May 2021 (release 2.1) Dynamic Gravity Dataset (DGD). The first data source includes consistent international and intranational trade data for 265 countries and 170 industries for the years 1986–2019 (Borchert et al. 2022). The second includes data on commonly used variables in gravity estimations, such as bilateral distance, existence of a common language or an FTA, among others (Gurevich and Herman 2018).
Regarding the trade data, ITPD-E includes international and intranational observations, expressed in nominal millions of dollars, of 170 industries. The inclusion of intranational trade in ITPD-E is an important feature. These types of observations allow for the estimation of theoretically consistent effects of FTAs on trade, given that FTAs affect both international and intranational trade flows (Yotov et al. 2016; Yotov 2022).
The industries included in ITPD-E are divided into four categories or bigger sectors: 28 agriculture (among them forestry and fishing), 118 manufacturing, 7 mining and energy, and 17 services sectors. Since our main focus in this paper is on the effects of CAFTA-DR on trade in goods, observations belonging to services were dropped. This leaves us with 153 instead of the original 170 industries. Although it would be ideal to analyze CAFTA-DR using the disaggregated data from those 153 industries in order to avoid any aggregation bias, the number of observations (more than 50 million) and fixed effects required in the estimation would make this task infeasible. In a recent article, Breinlich et al. (2022) showed that the Poisson pseudo-maximum likelihood (PPML) estimates from aggregate trade flows can, under certain circumstances, approximate the trade-weighted average of sector-level estimates. Therefore, the analysis is conducted using the aggregate data on trade in goods by importer, exporter, and year.
We use data from 1995 to 2018 because this creates a large enough sample to obtain representative effects of the agreement and the other control variables. There exist reasons to not use the whole period included in the second version of the ITPD-E. For the trade in goods, the data is only available for the three broad sectors after 1987. Using the data from 1995 onward limits the distortions in the data coming from country unifications, like Germany (1990), and divisions, like the Soviet Union (1991), Yugoslavia (1992) and Czechoslovakia (1993), without affecting the estimates of the CAFTA-DR effects. We have also noticed some odd behaviors of the ITPD-E intranational trade flows: After aggregating the values by exporter and year, the average value of intranational trade flows by year shows an abrupt decrease after 2015, as can be seen in Fig. 5. This appears to come from missing observations of intranational trade flows especially in the manufacturing sector after 2015, which results in inconsistent aggregate values of intranational trade flows.
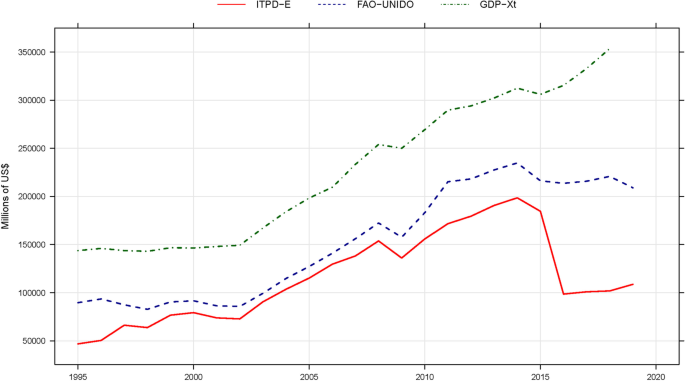
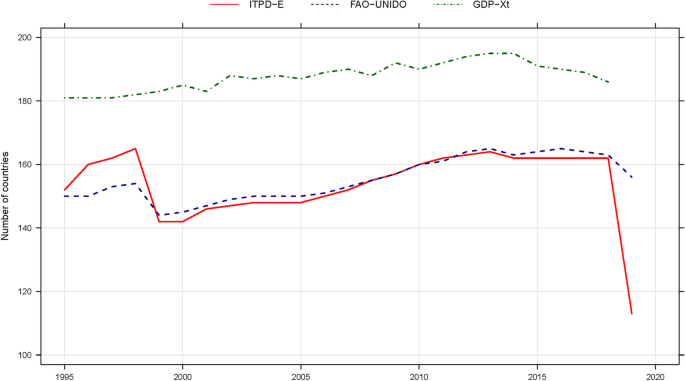
In order to correct this problem in the ITPD-E data, we collected and calculated new values of intranational trade flows, broad sector by broad sector, using the same sources used in the ITPD-E (the FAO and the INDSTAT and the MINSTAT from UNIDO datasets), Footnote 5 and then we added up to obtain the aggregate values of intranational trade flows by country and year. This appears to solve the problem with the intranational trade flows after 2015, as Fig. 5 also shows that the new intranational trade flows do not exhibit the same decrease in the values after 2015. However, there still exists a strong decrease in 2019 in the new data that appears to come from a reduction in the number of reporting countries. In the ITPD-E data, we see a similar sudden decrease (see Fig. 6), which made us decide to leave that year out of the sample as well. We also calculated another proxy of intranational trade flows using the difference between the nominal GDP (included in the DGD Footnote 6 ) and the total exports of our data. The three alternative ways to calculate intranational trade flows are all used for the estimation of the average CAFTA-DR effects, and the corresponding results are discussed in the following section.
From the Dynamic Gravity Dataset come the data for bilateral distance, country contiguity, common language, common colonizer, common legal origin, bilateral membership in the World Trade Organization (WTO), and signed free trade agreements. Some of these variables include missing values in case a country is not included in the DGD for some specific years. We have left these observations as missing values in our data, as oftentimes the country in question did not exist in these years. In addition, we also treat as missing the international trade observations corresponding to these countries. The bilateral distance variable is expressed in population-weighted kilometers between country-pairs and, as we also consider intranational trade flows in our data, includes both international and intranational distance. The original variable of bilateral WTO membership was slightly modified to be equal to one if both countries were WTO members and the observation corresponds to international trade, and zero otherwise. Footnote 7 Additionally, the FTA variable was modified to omit both the CA-DR FTA and the CAFTA-DR, being equal to one if both trading countries were in the same FTA, but not in CA-DR FTA or CAFTA-DR, and zero otherwise. The CAFTA-DR variable was constructed based on the effective date in each member state as reported to the WTO.
Our sample thus includes observations of 209 countries Footnote 8 between 1995 and 2018. It allows us to analyze the first 12 years of CAFTA-DR operation (2006–2018) and also to have observations from the years prior to the agreement. In order to obtain a balanced dataset, all possible trade flows between countries were considered in the sample. Since we include 209 countries and consider both international and intranational trade for the analysis, the balanced dataset consists of 209 exporters \(\times\) 209 importers \(\times\) 24 years \(=\) 1,048,344 exporter-importer-year observations. Any missing international trade observation was assumed to be equal to zero, i.e., interpreted as no trade between the considered two countries, except in the cases in which a country does not exist in the DGD for a given year. On the other hand, missing intranational trade observations were kept as missing. Table 1 provides a brief summary of our variables.
We now continue exploring the CAFTA-DR effects using the results of the intranational trade flows from FAO/UNIDO, whose results are shown in column 1 of Table 2, our preferred benchmark estimation, for two main reasons: (1) in column 2 (based on ITPD-E intranational trade flows), the observations for intranational trade flows appear to be inconsistent after 2015, as one can see in Fig. 5, which is likely affecting the coefficient estimates; and, (2) the intranational trade flows in column 3 (intranational trade flows calculated as GDP minus exports), though more consistent than those in column 2, are built based on the difference between nominal GDP, a value-added measure, and total exports of each country, a gross value measure, which likely leads to bias in the estimation. Footnote 21 Furthermore, given that the GDP also includes the service value-added, the intranational trade flows based on this approximation could be upward biased (compare Fig. 5). Therefore, for the coming robustness tests on the CAFTA-DR effects and the estimation of the other model specifications (Eqs. (5) and (6)), we rely on the intranational trade flows based on the FAO and UNIDO datasets that we used for column 1 of Table 2.
Our first robustness test is to check if the lack of an “anchor” intranational trade flow has any effect on the estimation. This means that we only consider in the estimation those exporters and importers that, for each particular year, have a positive observation for the intranational trade flow. If a country does not have a positive intranational observation, we drop all its international trade observations for the same year. This significantly reduces the number of observations. As can be seen in column 4 of Table 2, however, the removal of more than 200,000 observations does not really change the estimation results compared to column 1. In particular, the CAFTA-DR effects remain statistically insignificant.
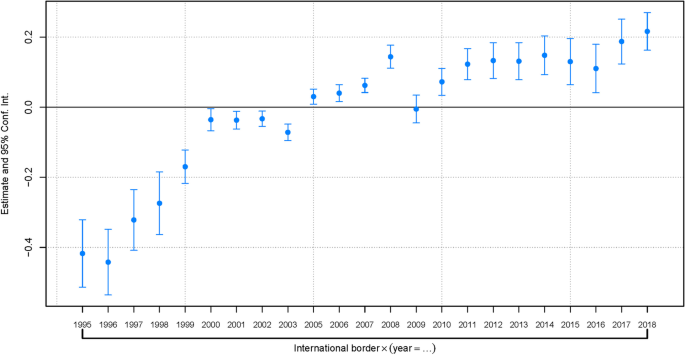
Another robustness test, reported in column 5, controls for any kind of common trend in the data, for example, due to a decrease in transportation costs over time. Following Bergstrand et al. (2015), this can be done by three alternative methods: (1) interacting a set of year dummies with a dummy variable representing international trade; (2) interacting a set of year dummies with the logarithm of bilateral distance; and (3) interacting each pair fixed effect with a time trend. For technical feasibility reasons, we only consider the first two methods. Footnote 22 As including all year dummies in the model would generate a problem of collinearity, we have selected 2004 as the reference year: The coefficients of the yearly international border and yearly distance effects should be interpreted as deviations from this reference year. Column 5 of Table 2 shows the results from interacting year dummies with an indicator variable for international trade. The results from this estimation are strange: FTA and WTO membership have a null effect on bilateral trade, whereas the CAFTA-DR effects are still negative, but their negative coefficients are bigger in absolute value and the total CAFTA-DR effect is negative and significant at the 10% level. The only variable that maintains its significance and positive effect is the CA-DR agreement. The results in column 5 of Table 2 not only are strange, but would also imply that neither other FTAs nor WTO membership has any effect on bilateral trade. This puts a question mark on the year dummies approach, as these variables could be controlling for something more than a negative trade cost trend in the data.
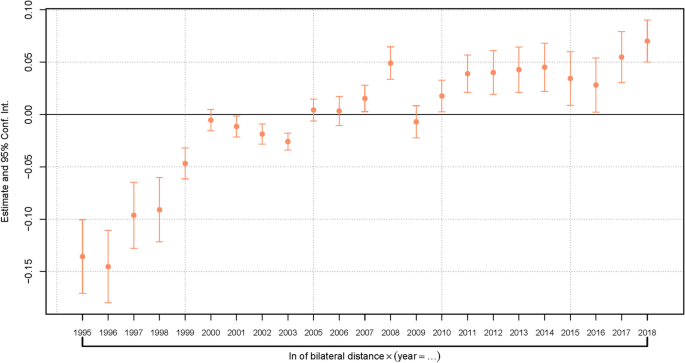
We proceed with the second alternative to control for a decreasing trade cost trend by estimating Eq. (4) with a set of year dummies interacted with the logarithm of bilateral distance (international and intranational). A major difference to the first alternative is that intranational trade flows are also subject to a trade cost trend over time, since the intranational distance is typically not zero. Moreover, trade cost decreases are allowed to matter more for countries that are further apart geographically. The results of this estimation are presented in column 6 of Table 2 and yield more reasonable results. Now, the FTA variable shows a smaller but significant and positive coefficient, increasing bilateral trade by \(\left(^-1\right)\times 100\approx 14\%\) (total effect). The WTO effect, on the other hand, strongly decreases, and it is now only significant at the 10% level. However, this is still a more consistent effect than the one found in column 5. The CAFTA-DR coefficients are still statistically insignificant. The effects of the CA-DR FTA are surprisingly more robust than of the other variables, even increasing slightly and maintaining statistical significance. When comparing the time effects captured by the two methods, we see in Figs. 9 and 10 that both have a similar trend over time: Trade costs indeed seem to decrease over time. The main difference between the two figures is the magnitude of the variables used to measure the trend, but their evolution over time is practically the same. Given the more consistent results found when including the year dummies interacted with the bilateral distance, we keep them for the next robustness tests of Eq. (4) and also include them when estimating Eqs. (5) and (6), in order to control for the common time trend in the trade data and in intra-CAFTA-DR trade in particular.
In column 7 of Table 2, we estimate the model using 3-year intervals to ensure that we allow trade flows to react to changes in trade policies (Yotov et al. 2016). The results of this estimation are consistent with the estimation in column 6 of Table 2. Some coefficients show small variations, but the estimates remain close to the results in column 6 and maintain their statistical significance, except for the WTO variable which becomes insignificant. Our estimates of the effect of CAFTA-DR remain statistically insignificant and with little change compared to column 6 where all years were included.
We also test the strict exogeneity of the variables used to measure the CAFTA-DR effects. A 5-year lead for CAFTA-DR is included in the model to measure the future effect of this agreement on bilateral trade. In the absence of reverse causality, this lead must be statistically insignificant (Yotov et al. 2016). As is shown in column 8 of Table 2, the coefficient on this lead variable is indeed statistically insignificant at the 10% level, and the other coefficients remain statistically significant and with practically no change. In light of these results, it is reasonable to assume that the dummy variables used to measure the effects of CAFTA-DR are strictly exogenous, and that there are no signs of reverse causality in our model. Yet, the effects of the CAFTA-DR on bilateral trade remain statistically insignificant.
As a last robustness test for our benchmark specification, we decided to include a 10-year lag for all our free trade agreement variables. The reason for this is to also reflect any long-term phase-in effects from the agreements, which have been found in other research. The inclusion of the 10-year lag for the CAFTA-DR, CA-DR FTA, and other FTA variables improve the results and total effect for our FTA variable and, curiously, reduced the total effect from the CA-DR FTA. In the case of CAFTA-DR, the inclusion of the 10-year lag does not change the main effect of this agreement on bilateral trade: it remains statistically insignificant.
In sum, all our estimations and tests lead to the same conclusion. When considering its average (treatment) effect, there is no evidence that CAFTA-DR has a positive or negative effect on members’ bilateral trade. However, we were able to find evidence in favor of the trade enhancing effects of other FTAs in general and of the CA-DR FTA in particular. In addition, we also find a trade-enhancing WTO effect, but it is only marginally significant (at the 10% level).
Even when controlling for a reduction of trade costs over time by introducing the geographical distance variable interacted with year dummies, the effects of the CAFTA-DR remain statistically insignificant. In an additional set of regressions, we explore whether any single member of CAFTA-DR is responsible for this null result. Table 12 shows in columns 1 and 7 that excluding Costa Rica and the Dominican Republic from our sample, respectively, alters our estimates of the 5-year lag CAFTA-DR effect, especially when excluding the Dominican Republic. Figures 3 and 4 had already shown peculiarities in the trade data of these two countries. If we exclude both countries from the sample, the CAFTA-DR total effect is positive and statistically significant at the 5% level. As we will show later, the change in sign and significance of the coefficients is related to the negative effects of CAFTA-DR on Costa Rica and the Dominican Republic. We will now explore the possibility of heterogeneous effects from the agreement on members’ trade flows by trade flow type (Eq. (5)) and trade direction (Eq. (6)).
In this part, we show the results from estimations of Eq. (5), which measures CAFTA-DR’s effects on members’ exports and imports. Results from this estimation are presented in Table 3, which only reports the total effects of CAFTA-DR by member and the regular coefficients of the FTA and WTO variables. Estimation result details can be found in Appendix Table 8.
According to these results, CAFTA-DR increased exports of four out of seven members. These increases are concentrated on El Salvador, Honduras, Nicaragua, and the USA. It is important to note that only Nicaragua actually increased its exports to the USA during the time period. In the case of the USA, CAFTA-DR led to an increase in its exports to El Salvador, Honduras, Guatemala, and Nicaragua. The other CAFTA-DR members with positive export effect trade more with other Central American members or with the Dominican Republic.
Concerning CAFTA-DR’s negative directional effects, these are concentrated on Guatemala and the Dominican Republic. Our estimations provide evidence of a reduction in Guatemalan exports to the USA and the Dominican Republic (and marginally to Costa Rica). Likewise, the Dominican Republic reduced its exports to Honduras, Costa Rica, and the USA. One explanation for part of the trade reduction of these countries is that they are diverting trade from the CAFTA-DR area to the rest of the world, as the export and import shares of these and other members show (Fig. 2). Similarly, another possible explanation is that their reduction is a consequence of being displaced by other members within the CAFTA-DR area.
Relating our estimates to the literature on the effects of CAFTA-DR, our results differ from some of the previously estimated effects on some members. Our results for Costa Rica do not support the findings of Koehler-Geib and Sanchez (2015) concerning its exports to and imports from the USA, as we could not find evidence of an increase in either. Contrary to the work of Sandoval et al. (2015), we do not find any significant effect indicating trade reductions in the case of El Salvador stemming from CAFTA-DR. In our case, CAFTA-DR is associated with an increase in the exports of El Salvador to Honduras (and possibly to Guatemala and Nicaragua, significant at the 10% level) and in its imports from the USA and Honduras. On the other hand, we do find evidence indicating that CAFTA-DR would have reduced the Dominican Republic’s exports to the USA, like in Reyes Peguero and Hansen (2019). Footnote 23
Regarding the other total directional effects of the agreement, which were not statistically significant at the 10% level, these are concentrated among the Central American countries and the Dominican Republic. A possible explanation of this may be previous preferential trade agreements predating the CAFTA-DR among those countries, such as the CA-DR FTA and the Central American Common Market (CACM). As a consequence of those previous agreements, it is possible that the CAFTA-DR does not contribute to enhancing trade among these members or it does so in a very limited way, given that these members already have reduced their trade barriers prior to the CAFTA-DR. This is consistent with our findings on the CA-DR FTA effects, as these were significant and positive and CAFTA-DR was expected to add little to bilateral trade between Central American members and the Dominican Republic.
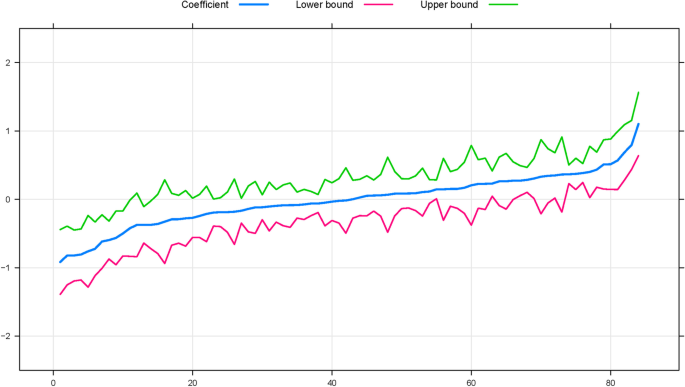
The results of Eq. (6) can be also related to the CAFTA-DR null effects from Eq. (4). The coefficients estimated using Eq. (6) are distributed around zero and being statistically not different from it, as Fig. 11 shows. These null effects were likely to be the ones estimated by Eq. (4). This also could be a consequence of considering all possible trade directions within the agreement (for the reasons discussed earlier). Again, our results highlight the importance of considering the presence of asymmetric effects within an FTA.
Contrary to our estimates in Tables 2, 3, and 4, which represent only the partial equilibrium effects of CAFTA-DR on bilateral trade, the results from our general equilibrium exercise presented in Table 5 (and Appendix Table 11) give us a better understanding of the impact of the agreement on member and non-member countries. Our general equilibrium calculations represent the impact of CAFTA-DR during the reference year 2018, when one considers its partial equilibrium effects (the coefficients from Eq. (6)) and their impact on inward and outward multilateral resistance terms, income and expenditure levels, and factory-gate prices, while keeping the trade balances between countries and countries’ total production quantities constant. As a consequence of the normalization of some of the key indices required to build the general equilibrium values, one must be careful with the interpretation of the results, as they represent the relative effect on each country in the sample with respect to the reference country. In the case of this study, the general equilibrium effects from CAFTA-DR are calculated with respect to those of Germany. Under the assumption that the formation of CAFTA-DR would have no significant effect on Germany, which is likely to be the case, we consider our general equilibrium effects as the true effect on each country.